UPDATE 2021: The recommended approach for embedding Tableau visualizations in Salesforce Lighting Experience is to use the Tableau Viz Lightning Web Component.
This post is part of a series that is exploring the capabilities and limitations of various data visualization tools when embedded in Salesforce.
This is an example of how to use Tableau’s JavaScript API to display and filter a Tableau dashboard on record pages in Lightning Experience.
Prerequisites
- Tableau Desktop: if you are working with test data, you can use the free Tableau Public application; if you want to test a more realistic scenario and see the full user experience, including authentication considerations and connecting directly to your Salesforce org, then you will need Tableau Desktop
- Access to Tableau Online or Tableau Server: you will need an environment where you can publish and host the Tableau dashboard online.
- Salesforce org populated with data you want to visualize; the example below uses data from the account and opportunity objects. You can create a free developer edition org that is pre-populated with data using this link.
Step 1: Create Dashboard in Tableau Desktop
Complete step 1 from the previous post
Step 2: Publish the Dashboard Online
Complete step 2 from the previous post
Step 3: Add the Tableau JavaScript API File as a Static Resource
Since Salesforce doesn’t allow us to call external JavaScript, we need to add the Tableau JavaScript API file as a static resource in the Salesforce org before creating the UI component.
Log into your Tableau Online/Server site and navigate the the URL of the current version of the JavaScript API, which will look something like this:
https://YOUR-SERVER/javascripts/api/tableau-2.3.0.jsSave the JavaScript file to your computer and upload the file as a Static Resource in your Salesforce org:
- Navigate to Setup -> Static Resources -> click “New” button
- Enter “tableaujsapi-230” for the Name
- Click “Choose File” and selected the file you downloaded
- Leave the default option for Cache Control
- Click the “Save” button
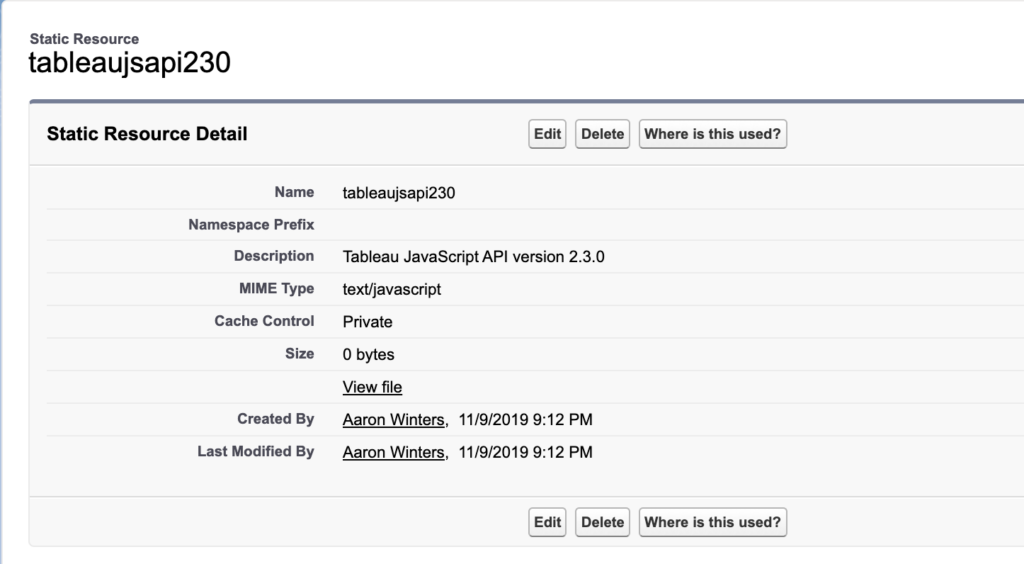
The result should look something like this
Step 4: Create the User Interface Component
Tableau’s documentation on their JavaScript API indicates using the JavaScript pattern of referencing the document global property to query the DOM, which is not supported in lightning web components. Many of the examples found online will work as written when using the Visualforce framework, so it is a good technology to use when getting started with Tableau’s JavaScript API.
Create a new Visualforce page by Navigating to Salesforce Setup, search for and open “Visualforce Pages”. Click the “New” button, enter “TableauJSapi” for the name and check the box “Available for Lightning Experience, Lightning Communities, and the mobile app”. Replace the placeholder code with the code below.
<apex:page standardController="Account" showHeader="false" sidebar="false">
    <apex:includeScript value="{!$Resource.tableaujsapi230}"/>
    <div class="container-fluid" id='viz'></div>
    <script type="text/javascript">
        window.onload = function() {
        var vizDiv = document.getElementById('viz');
        var vizURL = 'https://[URL FOR TABLEAU DASHBOARD]';
        var options = {
          height: '300px',
          width: '100%',
          hideTabs: true,
          hideToolbar: true,
          "Id (Account)": "{! Account.Id}"
        }

        viz = new tableauSoftware.Viz(vizDiv, vizURL, options);
      };
    </script>
</apex:page>
Navigate to your Tableau dashboard online and click the “Share” button. Copy the value in the link field starting from https:// until the first “?”, but do not include the “?” in your selection. Replace [URL FOR TABLEAU DASHBOARD] with the value you just copied. Save the Visualforce page.
Step 5: Embed Visualization in Salesforce Lightning Experience Records
Now we need to customize the Account record page to show the dashboard. Navigate to an Account record in your Salesforce org. Click the gear icon in the top right and select “Edit Page”. This will open the Account Record Page editor in the Lightning App Builder. Click the Tabs component, then the Add Tab button. Select “Custom” for the Tab Label and enter “Tableau JS” for the Custom Tab Label.
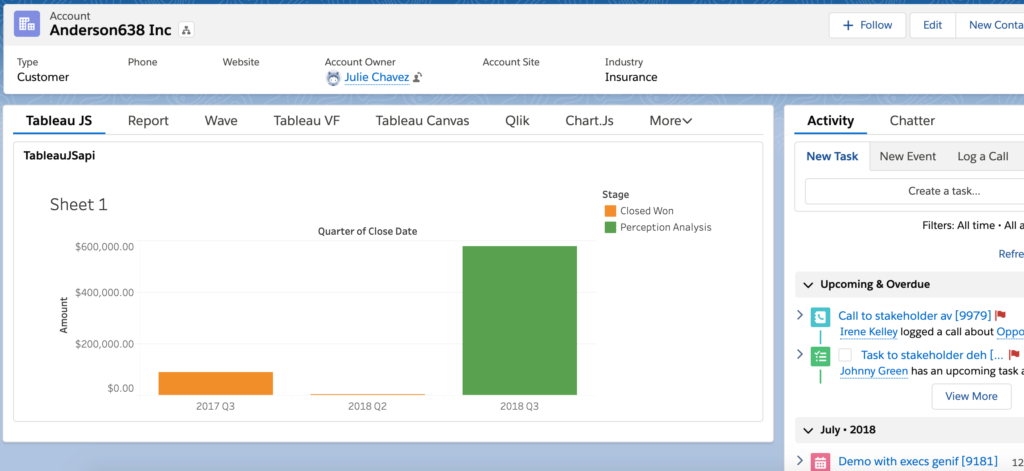
Click the Tableau JS tab, then drag Visualforce component from the list of Lightning Components onto the page. In the right pane, select TableauJSapi for the Visualforce Page Name and leave the Height blank to use the default height set by the Visualforce page. Save the Account Record Page and then view an account record to see the visualization.
Summary
Advantages of this approach include:
- Effort and skills required: Tableau Desktop is a robust tool and harder to learn than Salesforce reports and dashboards, but definitely very accessible. If you are savvy with Excel or other data manipulation tools, you’ll pick it up quickly. This approach also requires knowledge of JavaScript and Visualforce, but it should be possible to create a component once that is reusable for multiple use cases.
- Multiple devices: Tableau Desktop provides a number of features for design responsive layouts when creating the dashboard. This needs to be specified in Tableau, rather than in the Salesforce application. Custom record page tabs can also be created for the mobile layout, and Visualforce pages can be embedded in mobile cards or in page layouts and viewed in the Salesforce mobile app.
- Look and feel: There are a lots of chart types and options for customizing the styling and layout of charts and dashboards. This seems to be one of the key differentiators for Tableau.
- Large data volumes: Tableau Server/Online can handle very large data volumes.
- Data sources: Tableau supports many connectors to various data sources and data formats. This appears to be a particular strength of Tableau.
- Data model: Tableau provides robust functionality for restructuring and enhancing the data model to support visualization needs.
There are some limitations with this approach
- Accuracy of data: The flip side of being able to handle very large data volumes is that the data is not queried from the CRM in real-time. Data in Tableau visualizations are updated up to every hour so embedded visualizations may not be totally accurate, but hourly might be close enough for your requirements.
- Single sign-on: Assuming you do not already have SSO at your organization, this simple approach requires Salesforce users to log into Tableau Server/Online separately in order to view visualizations. However, it is fairly simple to set up SSO from Salesforce to Tableau Online/Server using Salesforce as the identity provider
- Data security: Tableau typically aggregates data from source systems into a new data set within Tableau and any Salesforce data security settings, such as object and field level security and record-level sharing, are not transferred by default. If your data security model is pretty open, this might not be an issue. For other scenarios, especially embedding in external-facing application pages, re-creating the field and row-level security in Tableau could be a significant effort.
- Deployment process: Source data, worksheets and dashboards are created in Tableau Desktop, then pushed to Tableau Server/Online and live separate from the Salesforce platform. The process for creating/updating embedded assets needs to be coordinated with the process for creating/updating the application page in which they are embedded.
Next post: Embed Qlik Sense Dashboard in Salesforce Records
Resources
- Tableau documentation: JavaScript API
- Tableau documentation: Publishing a workbook
- Tableau Embedded Analytics Playbook
- Salesforce documentation: Lightning App Builder


Aaron, you are my hero! Extraordinary good article.
great job, Aaron. Well put together walk-through and resources.